


MARKETVIEW
Strong development activity
with a considerable number
of speculative projects.
Poland Industrial, Q3 2015
Q3 2015
CBRE Research
© 2015 CBRE sp. z o. o. | 1
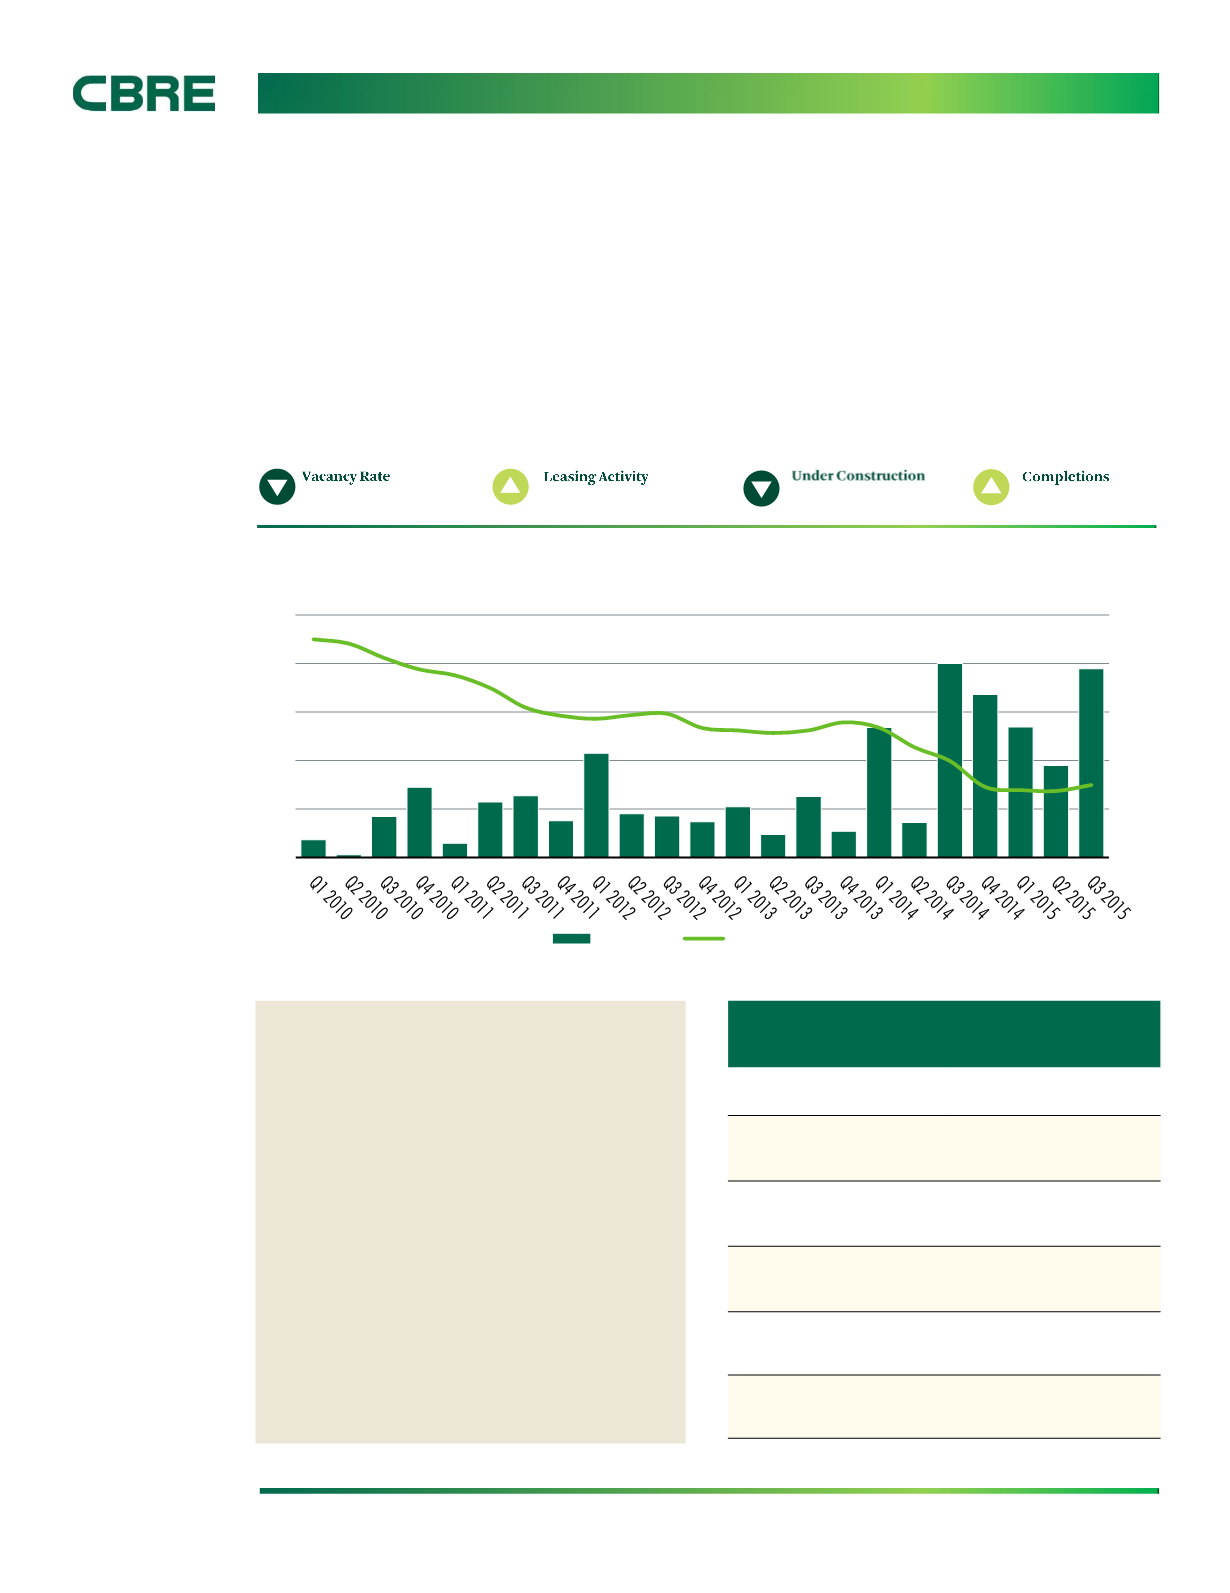
6.0%
*Arrows indicate change from Q1-Q3 2014.
Figure 1: Completions (000 sq m) and vacancy rate (%)
Source: CBRE Research, Q3 2015.
1.94 million sq m
580,000 sq m
850,000 sq m
HOT TOPICS:
•
Sharp decrease in prime industrial yields – currently
at 6.5%.
•
Ca. 850,000 sq m of newly completed industrial
and logistics space in Q1-Q3 2015. Total modern
supply exceeding 9.67 million sq m.
•
Over 580,000 sq m currently under construction.
Strong development activity with a considerable
number of speculative projects (more than 50%).
•
Developers have returned to Warsaw region.
Continuing interest in new locations such as
Rzeszow, Szczecin, Bydgoszcz as well.
•
Low vacancy levels. Average vacancy rate
for Poland at 6%.
•
Strong leasing activity in Q1-Q3 2015, indicating
a 27% increase y-o-y.
Summary
Total stock
9,674,200 sq m
Q1-Q3 2015 completions
848,100 sq m
Space under construction
582,900 sq m
Q3 2015 commencements
273,000 sq m
Vacancy rate
6%
Q1-Q3 2015 total leasing activity
1,937,100 sq m
Figure 2: Market summary
0%
4%
8%
12%
16%
20%
0
100
200
300
400
500
Completions
Vacancy rate