


 2 / 4
2 / 4

MARKETVIEW
Q3 2015
CBRE Research
© 2015 CBRE sp. z o. o. | 2
POLAND INDUSTRIAL
Figure 4: Largest project completions in Q3 2015
Figure 6: Headline rents, Q3 2015 (EUR/ sq m/ month)
Source: CBRE Research, Q3 2015.
Source: CBRE Research, Q3 2015.
2.0 2.5 3.0 3.5 4.0 4.5 5.0 5.5
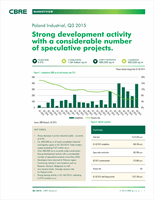
Figure 3: Investment volume (million EUR)
Source: CBRE Research, Q3 2015.
Figure 5:Total leasing activity (000 sq m)
Source: CBRE Research, Q3 2015.
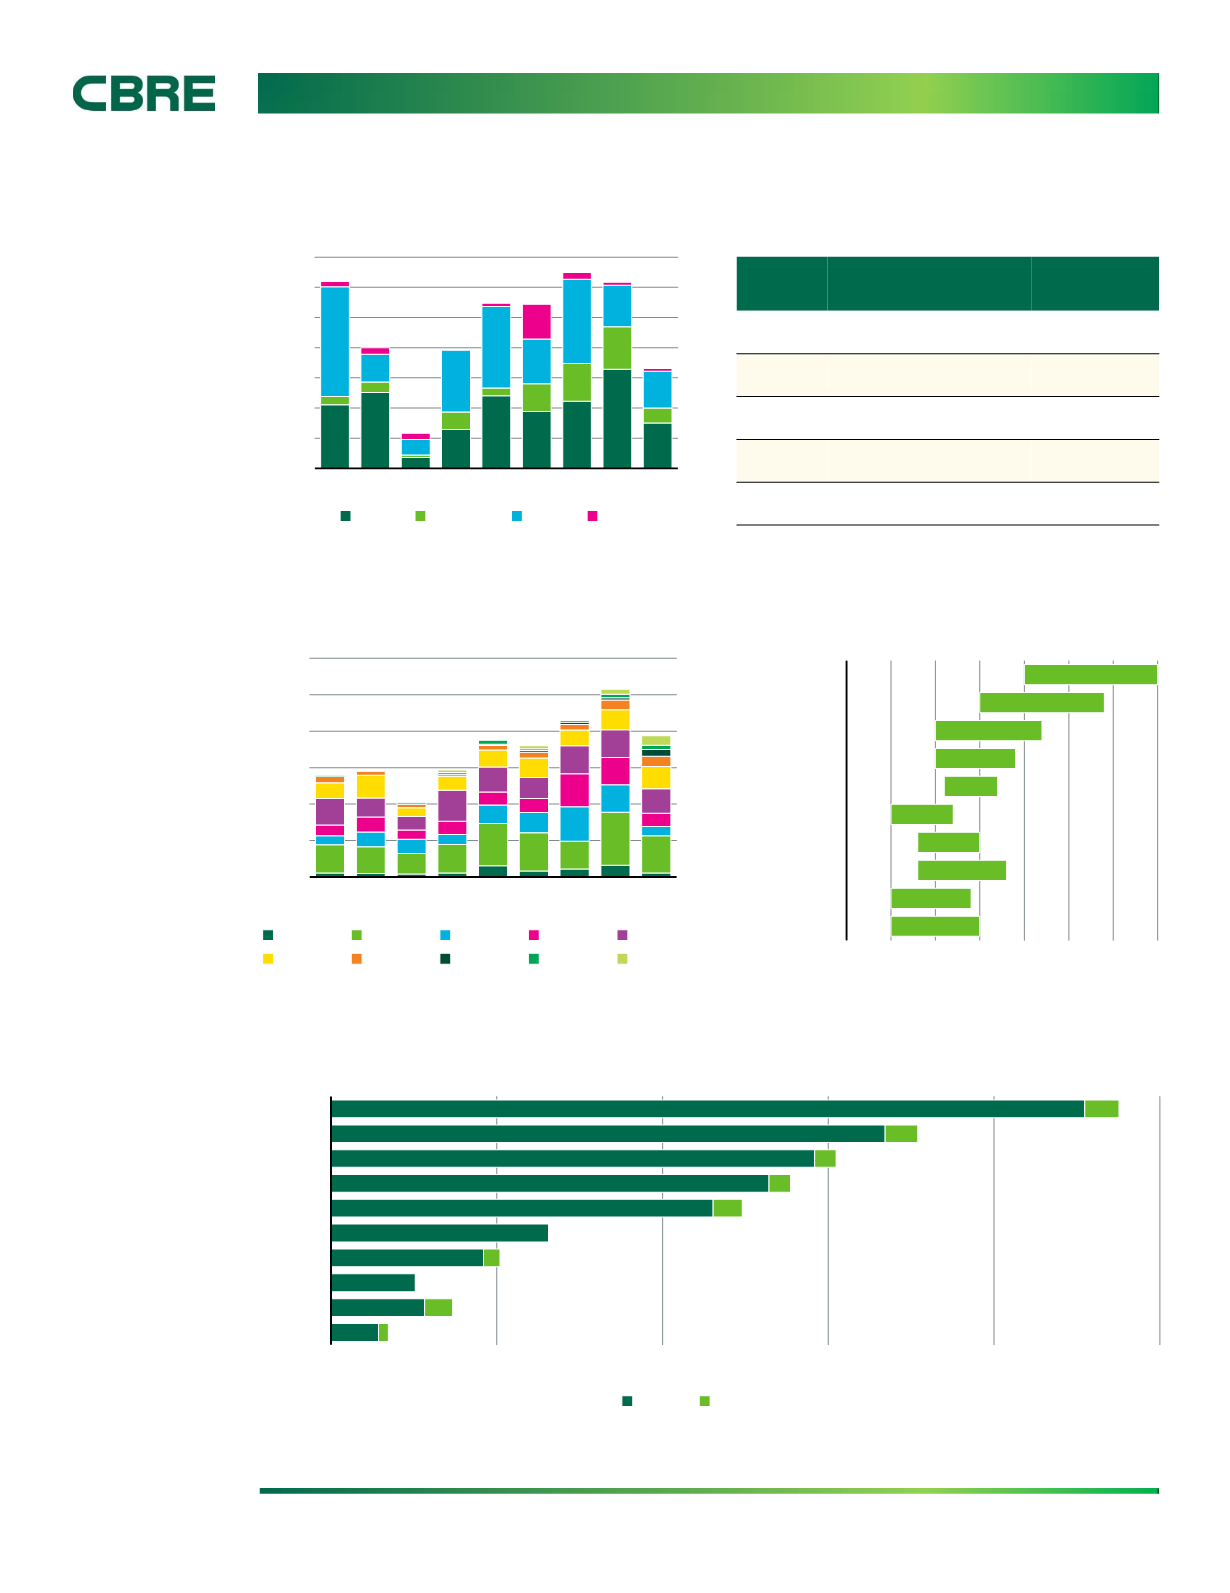
Figure 7: Industrial and logistics stock by region (000 sq m)
Source: CBRE Research, Q3 2015.
Region
Property
Size (sq m)
Wroclaw
Panattoni Park Wroclaw III
50,700
Silesia
Panattoni BTS Bielsko-Biala
45,000
Wroclaw
Goodman Wroclaw IV Logistics Centre
39,500
North
Goodman Pomeranian Logistics Centre
39,300
Central
Panattoni Business Center Lodz II
33,000
Silesia
Warsaw Region
Central
Poznan
North
Szczecin
Wroclaw
East
Krakow
Warsaw City
0
500
1 000
1 500
2 000
2 500
3 000
3 500
2007 2008 2009 2010 2011 2012 2013 2014 2015
Office
Industrial
Retail
Other
0
500
1 000
1 500
2 000
2 500
3 000
2007 2008 2009 2010 2011 2012 2013 2014 2015
Warsaw I
Warsaw II
Wroclaw Poznan
Silesia
Central
North
Szczecin
Krakow
East
0
500
1 000
1 500
2 000
2 500
Szczecin
East
Krakow
North
Warsaw I
Central
Wroclaw
Poznan
Silesia
Warsaw II
Existing Under construction